Glancing up at the canopy of trees on a summer day it’s easy to imagine that the leaves overhead are infinite. Of course we know that’s not true – but have you ever wondered just how many leaves there actually are in the world? It’s a fascinating question to ponder. While we may never know an exact number, we can make some educated guesses about the global leaf population.
In this article I’ll walk through the challenges of counting all of Earth’s leaves look at how scientists estimate leaves per tree, examine total global tree estimates, and calculate a reasonable worldwide leaf range. Beyond the numbers, we’ll also explore some of the marvels of nature’s ingenious leaf designs. Read on to appreciate the planet’s abundant and diverse leafy wonders!
The Difficulty of Counting Leaves
Trying to tally up all of Earth’s leaves poses some inherent difficulties. Leaves constantly fluctuate in number as trees grow, shed, and regrow leaves seasonally. The planet also harbors a staggering diversity of tree species, each with different leaf yields. Specific factors like a tree’s age, sunlight access, soil nutrition, and water availability impacts how many leaves it can support.
If we could stop time and count every leaf on Earth right then, the number would change a lot from season to season as trees lose their leaves and grow new ones. Because of these problems, the best we can hope for is a good guess.
Estimating Leaves Per Tree
To figure out how many leaves are on trees around the world, scientists first look at how many leaves each tree produces.
-
Deciduous trees like oaks, maples, and apples grow around 200,000 leaves per season.
-
Conifers like pines and firs host around 100,000 needles at a time.
-
Over its lifetime, a tree will generate around 3,600 pounds of leaves.
The number of leaves has a lot to do with how much food the tree needs to make food and stay healthy. With these averages, we can scale up to wider estimates.
Global Tree Population
To determine potential leaf totals, we need to know the global tree population. Experts estimate that Earth harbors:
- 3 to 4 trillion trees worldwide
This factors in total forest coverage as well as urban and suburban trees. Breaking down the numbers further:
- Russia has around 642 billion trees, the most of any country
- Canada has approximately 318 billion trees
- Brazil has around 302 billion trees
- The United States has about 228 billion trees
- China has around 140 billion trees
Areas with expansive forest coverage tend to harbor the most trees, while desert and tundra regions have far fewer.
Calculating Worldwide Leaf Range
Now we can combine the average leaf yield per tree with total global tree estimates to form an approximation of Earth’s leaf population.
With around 3 trillion trees worldwide, if the average mature tree grows 200,000 leaves, the total comes out to 600 quadrillion leaves at any given point in time. Factoring in seasonal variation, the number likely ranges from 300 quadrillion to over 1 quintillion leaves globally.
This estimate provides a snapshot, not accounting for fallen leaves or displacement from wind and animals. But as a baseline, hundreds of quadrillions serves as a reasonable approximation of Earth’s leaf abundance.
The Marvels of Nature’s Leaves
We may not think much of leaves, but they are actually amazing natural inventions. Plants use photosynthesis to get energy from the sun, which is made possible by the green pigment chlorophyll. Vein structures transport water and nutrients. Through tiny pores, leaves also help control the flow of gases and water.
Trees strategically drop leaves to minimize water loss in winter and prevent snow damage. And the vivid colors of fall leaves result from the breakdown of chlorophyll and emergence of other pigments like carotenoids. Leaves nourish ecosystems, create shelter and food for wildlife, and inspire awe with their beauty and diversity. They represent the limitless creativity possible with just sunlight, water, soil, and air.
Appreciating Our Leafy World
While we may never know the exact number of leaves worldwide, we don’t need an exact figure to appreciate their gifts. Leaves support all life on Earth in countless ways. Their annual cycle exemplifies nature’s wise survival strategies.
The next time you crunch through crisp fall leaves, pause to consider the abundant diversity underfoot. Look closely at the vein patterns and tiny specialized cells. Notice how perfectly leaves suit their local climate and habitat. Delight in nature’s capacity for invention and interconnectedness.
Although unfathomable in quantity, Earth’s leaves are invaluable – both for forests and for all the creatures dependent on them. Our planet’s leafy abundance and variety is well worth appreciating in its own right.
Types of Oak Trees By Leaf
The below table highlights the types of oak trees by leaf:
| Type of Oak Tree | Leaf Characteristics |
| Pin Oak (Red Oak variety) | Shiny, green leaves with deep lobes and pointed tips. The lobes are jagged. |
| Water Oak (Red Oak variety) | Oblong leaves, or three-lobed leaves with bristles at the tips. |
| Black Oak (Red Oak variety) | Dark green, glossy leaves with deep notches and pointy lobes. |
| Cherrybark Oak (Red Oak variety) | Haphazardly lobed leaves with hair on the underside. |
| Northern Red Oak (Red Oak variety) | Dark green leaves with lobes and jagged edges at the tips. |

| Type of Oak Tree | Leaf Characteristics |
| Scarlet Oak (Red Oak variety) | Deep lobes and sinuses shaped like the letter C. The edges are topped with bristled teeth. |
| Southern Red Oak (Red Oak variety) | Slender leaves with deep lobes and large gaps between the lobes. |
| Japanese Evergreen Oak (Red Oak variety) | Ovate leaves with round tips and long points. |
| Laurel Oak (Red Oak variety) | Small diamond-shaped leaves, with occasional lobes. |
| Willow Oak (Red Oak variety) | Narrow, lanceolate leaves with pointed tips and no lobes. |

| Type of Oak Tree | Leaf Characteristics |
| California Live Oak (Red Oak variety) | Thick, oval leaves with spines around the margins. |
| Shumard Oak (Red Oak variety) | Leaves with pointed lobes and bristles at the tips. These leaves turn a brilliant shade of red during the fall. |
| Turkey Oak (Red Oak variety) | These leaves resemble a turkey foot and have three distinct lobes. |
| Eastern White Oak (White Oak variety) | Ovate leaves with distinct lobes and round tips. |
| English Oak (White Oak variety) | Small, round leaves, with no jagged edges. |
| Type of Oak Tree | Leaf Characteristics |
| Post-Oak (White Oak variety) | The shape of these leaves resembles the Maltese cross. |
| Bur Oak (White Oak variety) | Large leaves with tiny lobes and a round apex. |
| Sand Post Oak (White Oak variety) | Leaves with deep lobes, and round tips. |
| Oregon White Oak (White Oak variety) | Shiny green leaves with lobes and round tips. |
| Sessile Oak (White Oak variety) | Slightly lobed leaves with jagged edges. |

| Type of Oak Tree | Leaf Characteristics |
| Chestnut Oak (White Oak variety) | Leaves cluster together and have V-shaped veins and bristled edges. |
| Holm Oak (White Oak variety) | Shiny oblong or lanceolate leaves with no lobes. |
| Chinkapin Oak (White Oak variety) | Chinkapin leaves resemble chestnut leaves but have sharper teeth and no bristles. |
| Live Oak (White Oak variety) | Elliptical, thick, dark green leaves with hairs on the underside. |
| Swamp White Oak (White Oak variety) | Ovate leaves with tapered ends and up to seven lobes. |

| Type of Oak Tree | Leaf Characteristics |
| Gambel Oak (White Oak variety) | Oval leaves with deep lobes. |
| Overcup Oak (White Oak variety) | Thick, green leaves with a wedge shape and up to nine lobes. |
| Swamp Chestnut Oak (White Oak variety) | Obovate leaves with jagged margins. |
| Dwarf Chestnut Oak (White Oak variety) | Ovate leaves with smaller lobes. |
| Bluejack Oak (White Oak variety) | Shiny, ovate leaves with a round apex. |

| Type of Oak Tree | Leaf Characteristics |
| Bluff Oak (White Oak variety) | Elliptical leaves with shallow lobes. |
| Chapman Oak (White Oak variety) | Oblong leaves with a round apex. |
| Myrtle Oak (White Oak variety) | Obovate leaves with no lobes. |
| Blue Oak (White Oak variety) | Elliptical leaves, either with or without lobes. |
| Canyon Live Oak (White Oak variety) | Lanceolate leaves with pointed tips.9 |

Read More About: Oak Tree Guide: 7 Types, Colors, Leaves, Identification (How to Buy, Plant)
Dogwood tree leaves are classified as simple leaves that grow opposite one another on tree stems. Some dogwood trees have alternate growing leaves. Most dogwood leaves are oval-shaped with smooth edges.
Birch tree leaves have an egg shape, pointy tips, and jagged margins. They are classified as simple leaves and grow alternately on branches.
The Cottonwood tree leaf is shaped like a triangle with a base in the shape of a heart. The leaf ends in a point, and the top is glossy green while the bottom is paler.
Read More About: Cottonwood Tree Guide: Identification of Eastern, Leaves, Seeds & More
How Many Leaves Does an Apple Tree Have?
So, how many leaves does an apple tree have?
Apple trees require 10 mature leaves to support one apple. As an example, if an apple tree had 500 apples, it would need to have 5000 leaves. The fruit-to-leaf ratio is obtained by nitrogen fertilizer applied annually.
Fall and Autumn Counting Song for Kids – How Many Leaves? – ELF Learning
FAQ
Are there more leaves than stars?
There are more trees on Earth than stars in the Milky Way galaxy. Yes, you read that right.
Are there more blades of grass or leaves?
However, the number of leaves a tree could have in a square meter is still more than the number of grass blades in that same square meter. Trees and grass do not occupy the same space on the ground (trees shade out the grass). This is an advantage for the trees.
How many leaves are there in the US?
They figured out that there are approximately 200 billion trees in the country, which have somewhere around 200,000 leaves each. So if you do the math that adds up to around 40 QUADRILLION leaves.
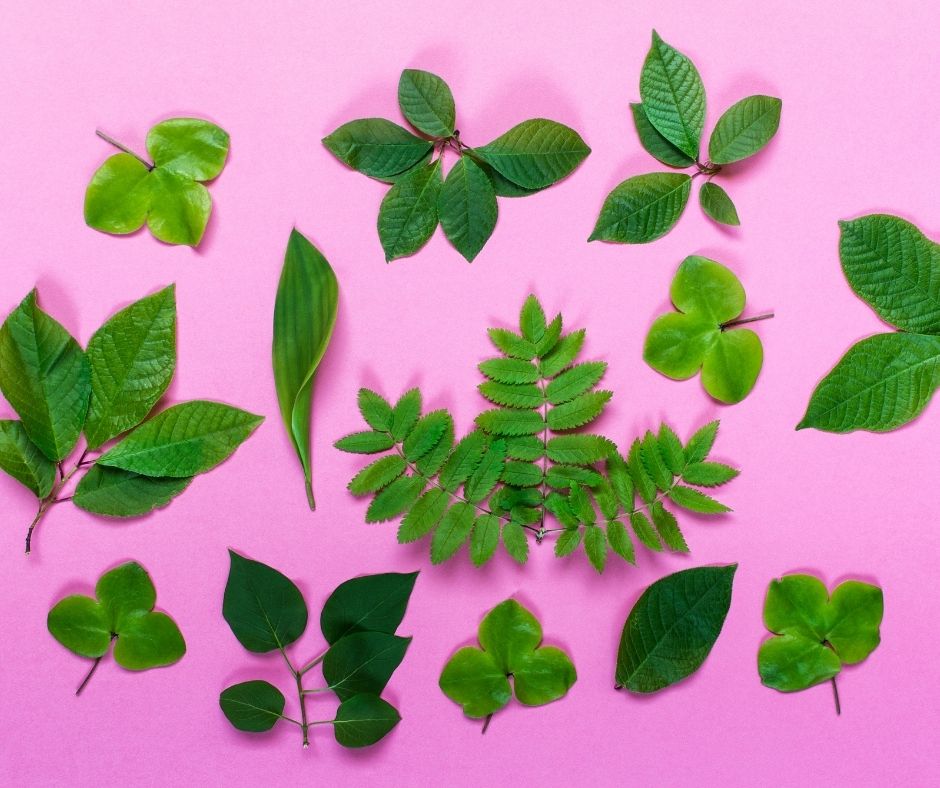
How many types of leaves are there in the world?
There are two different types of leaves – simples leaves and compound leaves. The other types of leaves include acicular, linear, lanceolate, orbicular, elliptical, oblique, centric cordate, etc. They perform the function of photosynthesis and help in the removal of excess water from the aerial parts of the plant.